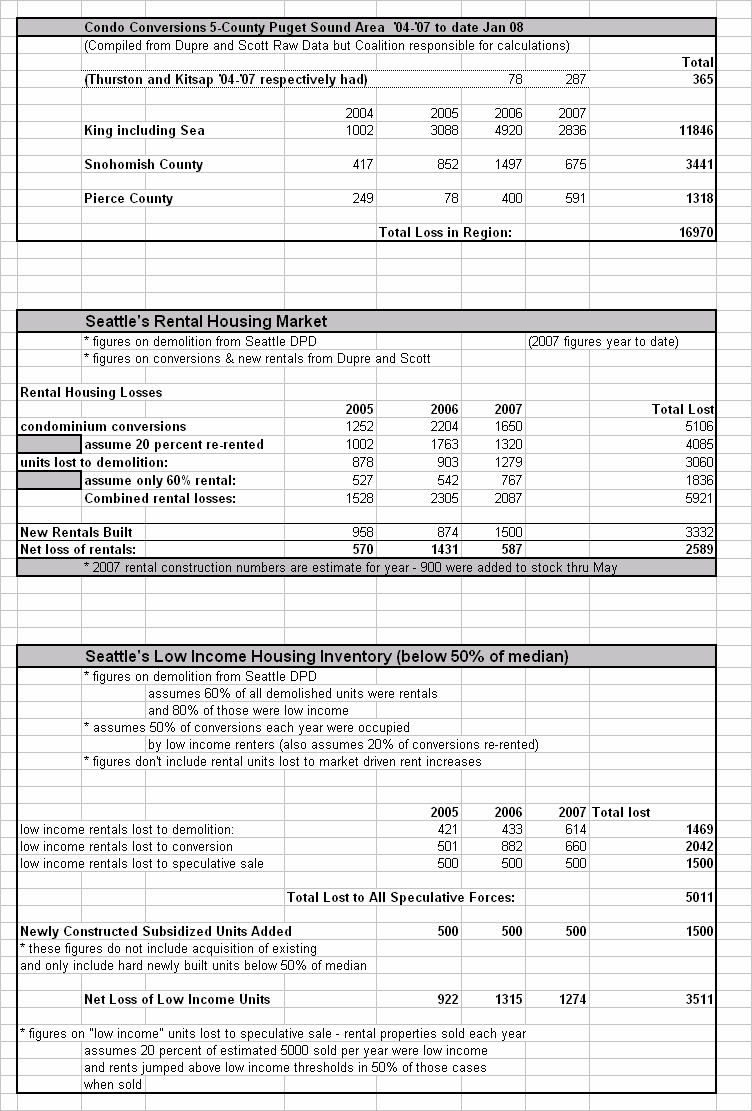
Condo Conversions and Housing Demolitions Ravage Seattle and Puget Sound Low Income Rental Housing Market!
** These figures below are drawn from raw data provided by the City of Seattle and Dupre and Scott. We are solely responsible for the calculations and conclusions and how we've presented the data

| Conversions Broken Down by Neighborhood Jan '04 - Jan 08 |
units |
projects |
units |
projects |
||||
| Auburn | 194 | 3 | ||||||
| Ballard | 249 | 23 | Olympia | 78 | 1 | |||
| Beacon Hill | 166 | 6 | Paine Field | 689 | 6 | |||
| Bellevue | 1171 | 22 | Puyallup/Sumner | 165 | 5 | |||
| Belltown | 310 | 5 | Queen Anne | 758 | 27 | |||
| Bothell | 497 | 5 | Rainier Valley | 30 | 1 | |||
| Bremerton | 209 | 1 | Redmond | 228 | 4 | |||
| Capitol Hill/Eastlake | 645 | 28 | Renton | 281 | 3 | |||
| Central Seattle | 368 | 12 | Seatac | 153 | 1 | |||
| Central Everett | 191 | 6 | Shoreline | 222 | 4 | |||
| Des Moines | 304 | 5 | Silver Lake | 504 | 6 | |||
| Dwtwn Tacoma/Stadium | 409 | 18 | Tacoma | 914 | 31 | |||
| Edmonds | 449 | 12 | Thrashers Corner | 266 | 2 | |||
| Everett | 1122 | 20 | University | 104 | 1 | |||
| Federal Way | 841 | 9 | W. Seattle | 272 | 10 | |||
| Factoria | 542 | 7 | Burien | 17 | 1 | |||
| White Center | 15 | 2 | ||||||
| Fife/Milton | 36 | 1 | Woodinville/Totem Lake | 292 | 3 | |||
| First Hill | 554 | 8 | ||||||
| Gig Harbor | 71 | 2 | others | |||||
| Greenlake Wallingford | 448 | 26 | Ruston | 16 | 1 | |||
| Issaquah | 521 | 5 | Burien | 62 | 2 | |||
| Juanita | 841 | 9 | Kenmore | 329 | 3 | |||
| Kent | 247 | 3 | Mercer Island | 92 | 2 | |||
| Kirkland | 1146 | 16 | Newcastle | 140 | 1 | |||
| Lakewood | 116 | 4 | North Bend | 20 | 2 | |||
| Lynwood | 721 | 8 | ||||||
| Magnolia | 145 | 7 | ||||||
| Marysville/monroe | 23 | 1 | ||||||
| Mid Tacoma | 42 | 3 | ||||||
| Milton | 36 | 1 | ||||||
| Mill Creek | 262 | 2 | ||||||
| Mountlake Terrace | 109 | 2 | ||||||
| Mukilteo | 424 | 3 | ||||||
| Monroe | 60 | 1 | ||||||
| North Seattle | 734 | 22 | ||||||